A redesign case built entirely on projected profit, not opinion.
Projected profit uplift from the redesign, over a 3-year period.
Retention increase used as the sole lever in the model, for simplicity.
One-off redesign cost, recovered from Year 1 onward.
Project Overview
Project Overview
The user problem
Design work is easy to describe qualitatively but hard to defend in a budgeting conversation. Without a shared, numeric language, a redesign initiative competes for investment against proposals that already speak in dollars.
The business objective
Make the case for a redesign initiative tangible, by quantifying its value against the company's own profit tree, financial impact and historical facts, rather than describing it only in UX terms.
My role and scale of ownership
I built the full financial model behind this redesign case myself: defining the business lever, sourcing salary and cost benchmarks, building the year-by-year profit projections with and without the redesign, and packaging the result into a business case a non-design stakeholder could approve on the numbers alone.
How I got from insights to product value
Business lever
Mapped the company's goal onto a profit tree to isolate the single lever the redesign could move.
Facts
Sourced current salary, cost and usage data to build a historical estimation of what has already happened.
Hypothesis
Prototyped a projection of what the impact could be, with and without the redesign, year by year.
Financial impact
Compared both scenarios over time to quantify the metrics that justified the investment.



Execution
Execution
Making the initiative tangible by quantifying the value of design work using 3 pillars: business lever, financial impact, and hypothesis and facts.
Business lever
Turning a stakeholder ask into a number
The starting question: what company goal are we trying to achieve with the redesign project? The stakeholder answer: "Increase customer retention by 1%." To connect that goal to the company's bottom line, I mapped it onto a profit tree:
profit splits into revenue (more customers, more value) and costs (less fixed costs, less variable costs). For simplicity, the calculations in the projections focus on retention rate only, the lever most directly moved by the redesign.
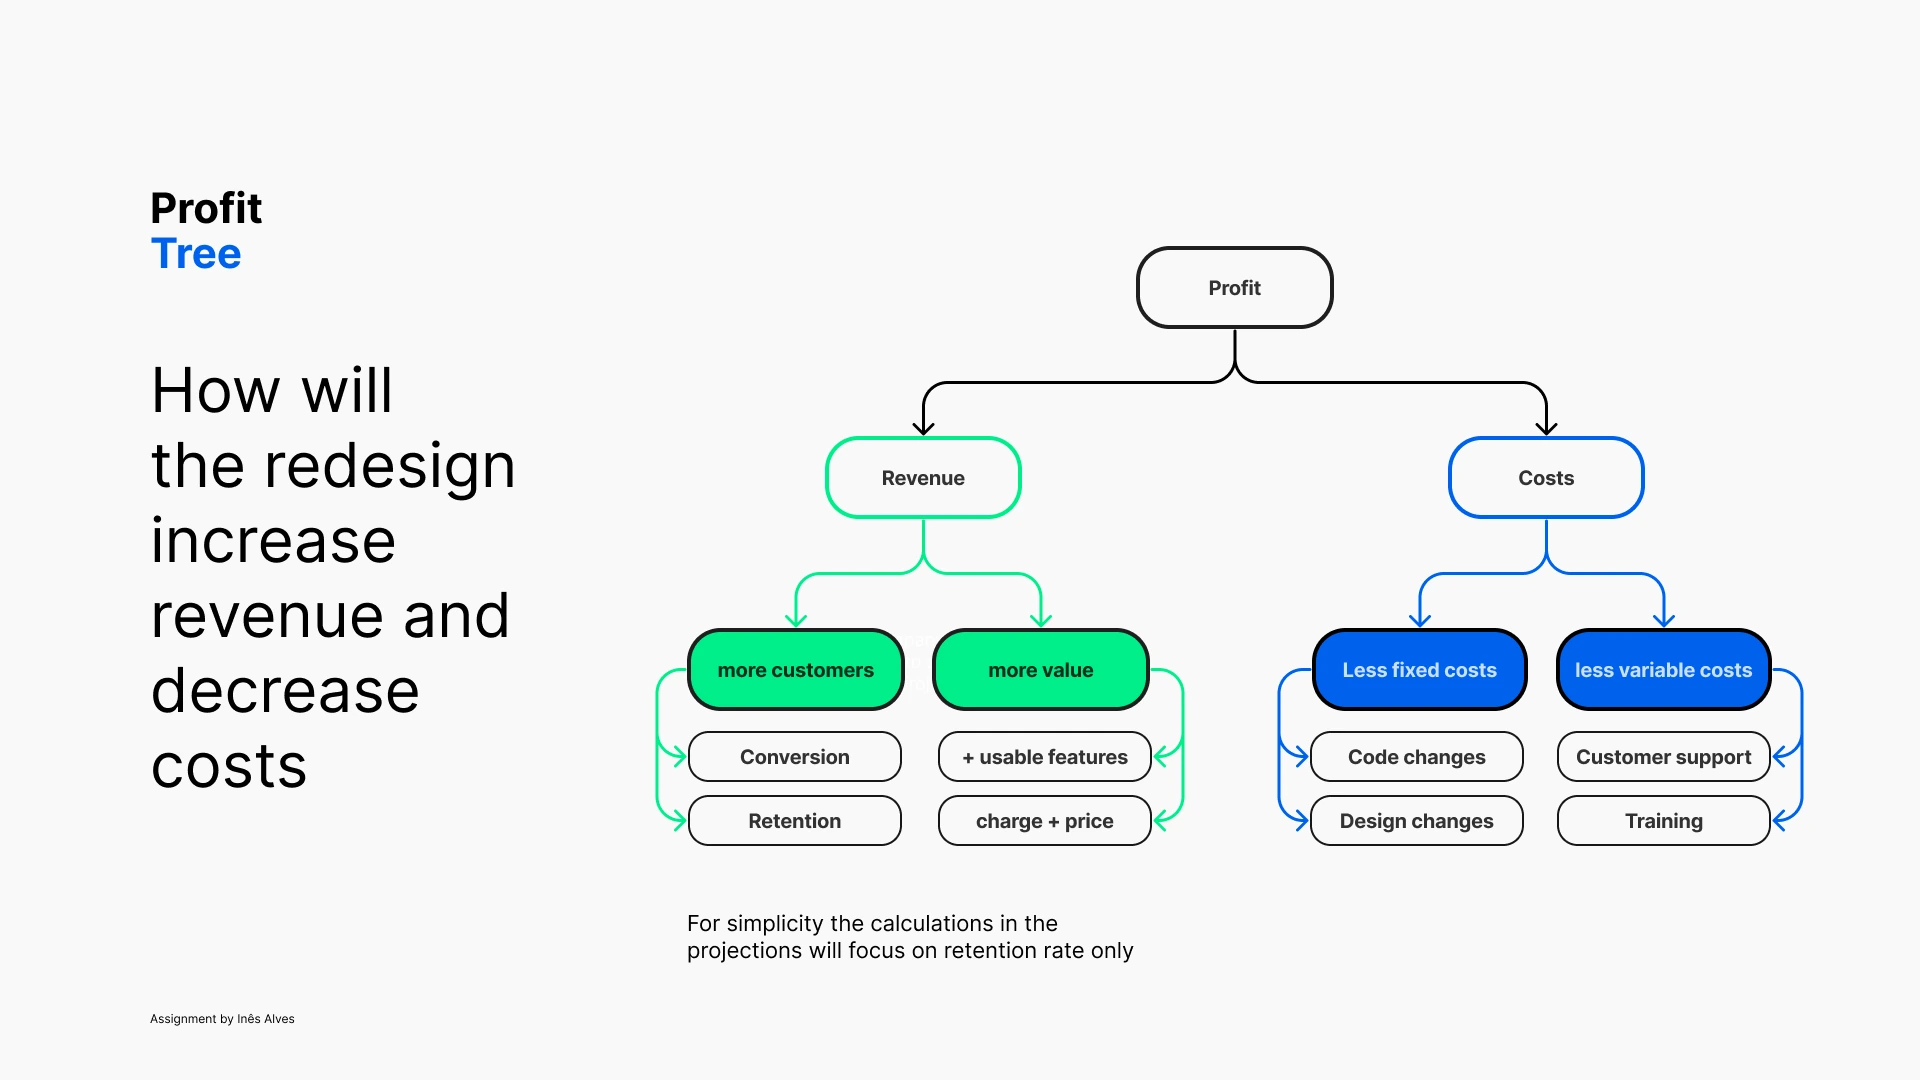
Profit tree, isolating retention as the redesign's primary lever.
Hypothesis and facts
Making historical estimations and projections
With the lever defined, the model split into two halves:
- Facts: historical estimation of what has already happened.
- Hypothesis: prototyping a projection of what the impact could be.
The current fixed costs come from code and design refactoring: inefficiencies from fixing individual components rather than journeys, flows and design system patterns are making fixes cost escalate.
Sourced software engineer and UX designer salaries put the annual fixed cost of code and design changes at $136,274 and $93,068 respectively, a $229,342 total.
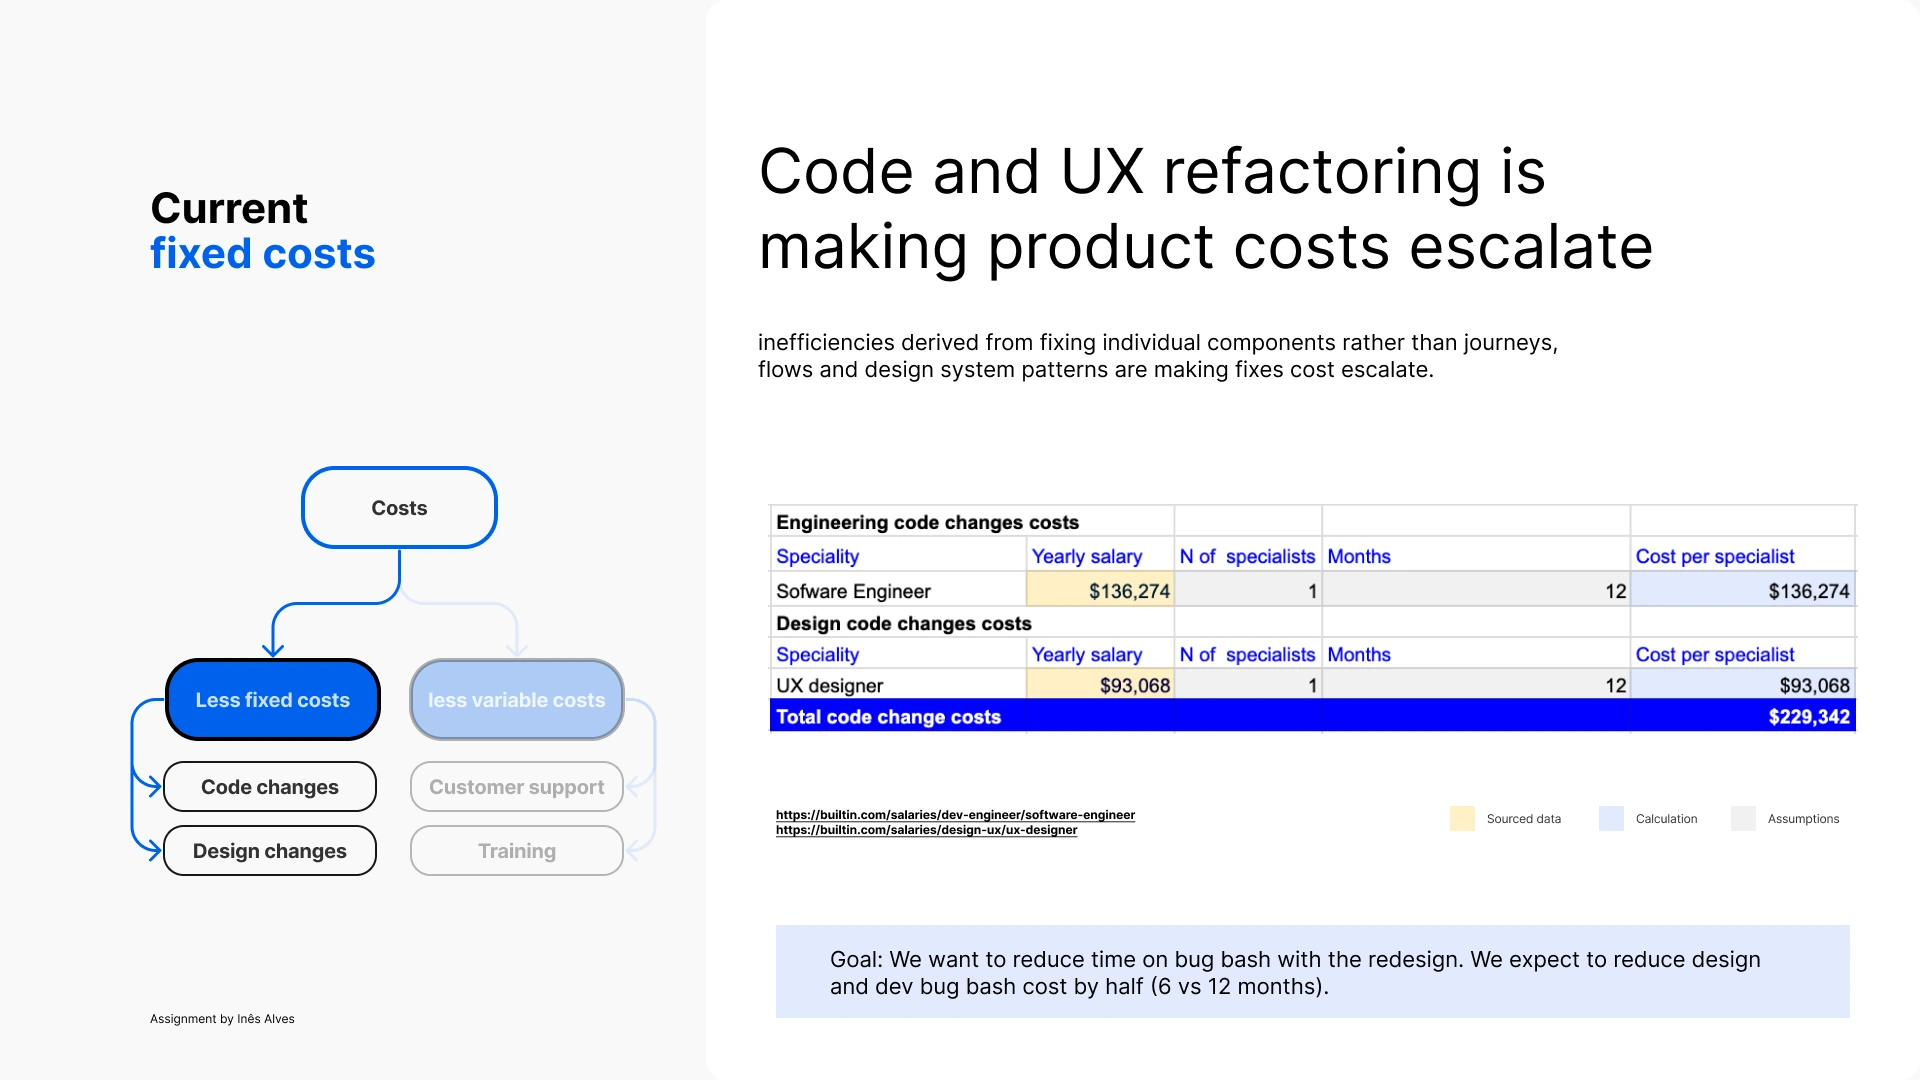
Current fixed costs: code and UX refactoring making product costs escalate.
Goal: reduce design and dev bug-bash cost by half (6 vs. 12 months).
On the variable side, poor UX is generating a cost dependency from training and support: outsourced customer support and training teams, paid per deliverable, were meant to be a low variable cost but were weighing more and more on the company due to poor user experience.
Sourced costs put a support ticket at $2.15 and a training session at $393.47.
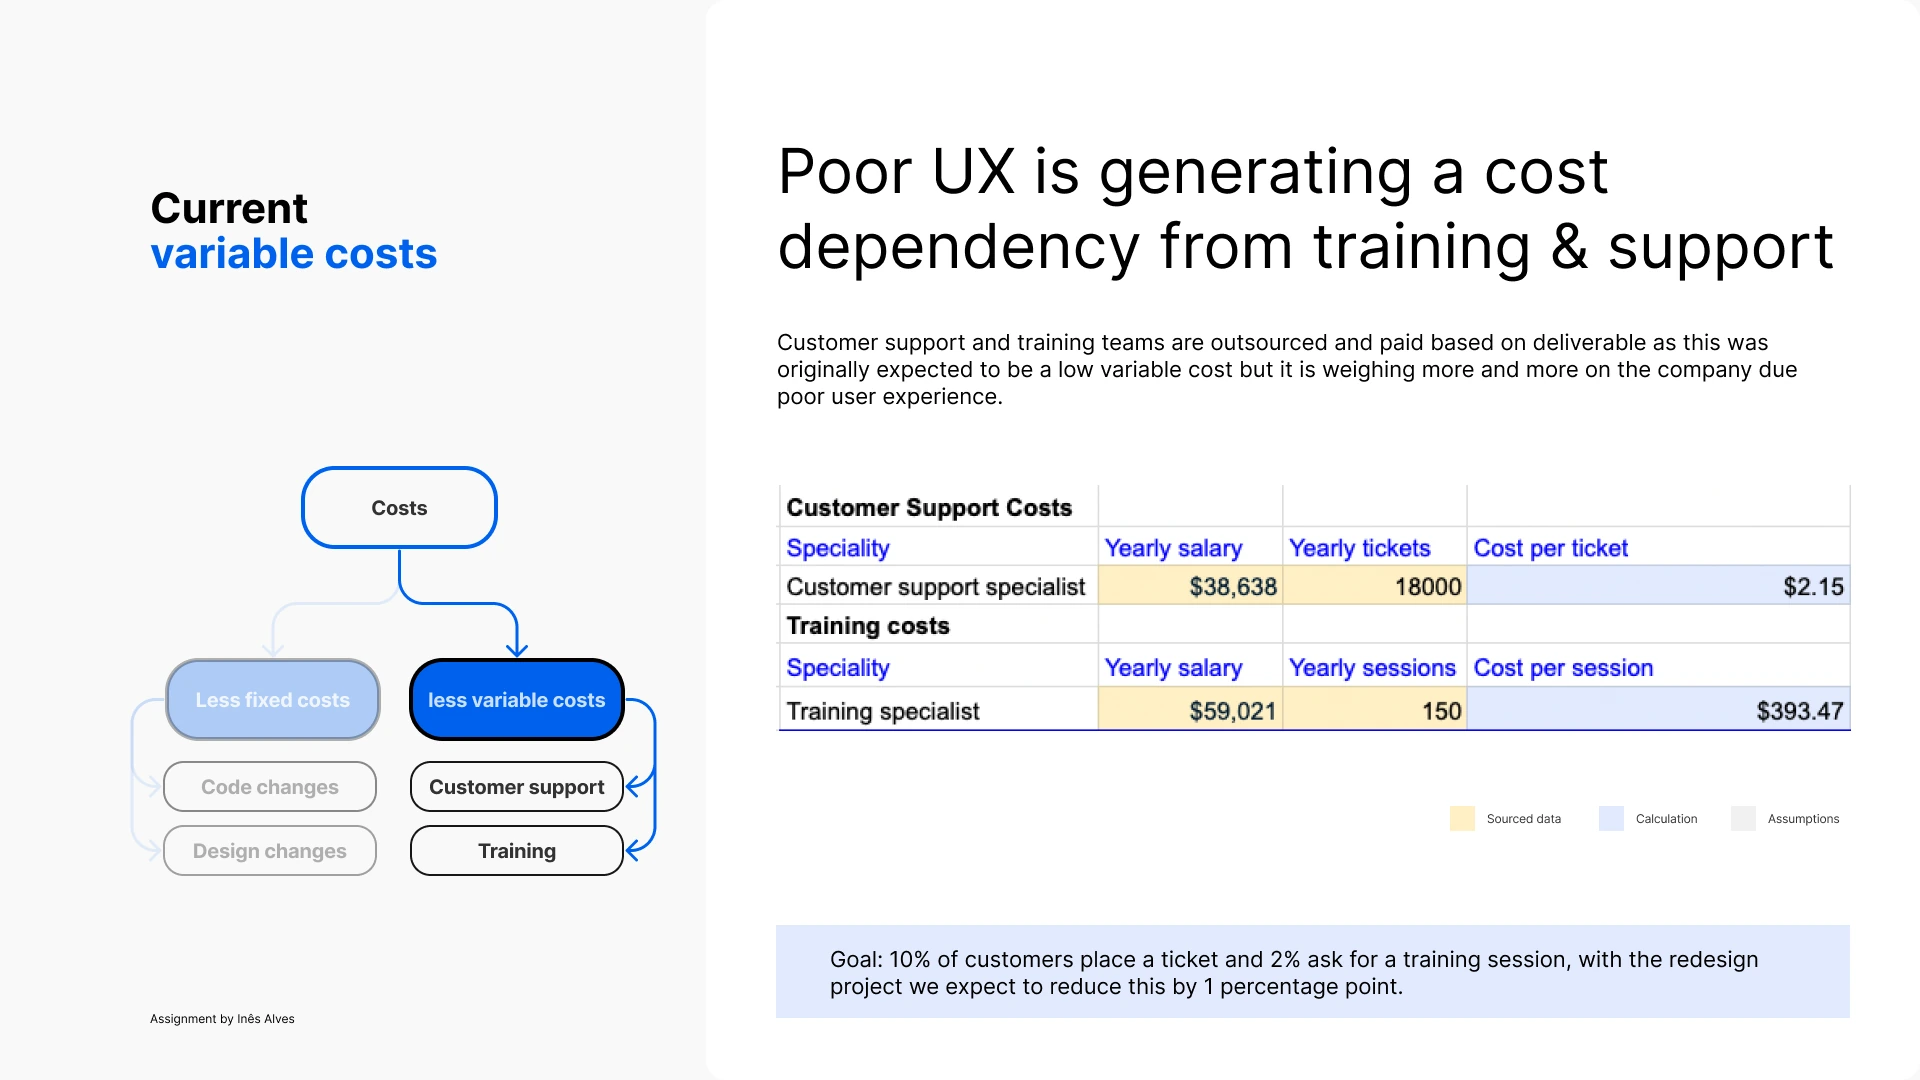
Current variable costs. Goal: reduce customers raising a ticket or requesting training by 1 percentage point each with the redesign.
Financial impact
Metrics quantifying the impact
First, the projected one-off cost of doing the redesign itself: a 6-month team of 1 UX researcher, 3 senior UX designers and 1 senior design ops/systems specialist, benchmarked against public salary data, totalling $290,633.
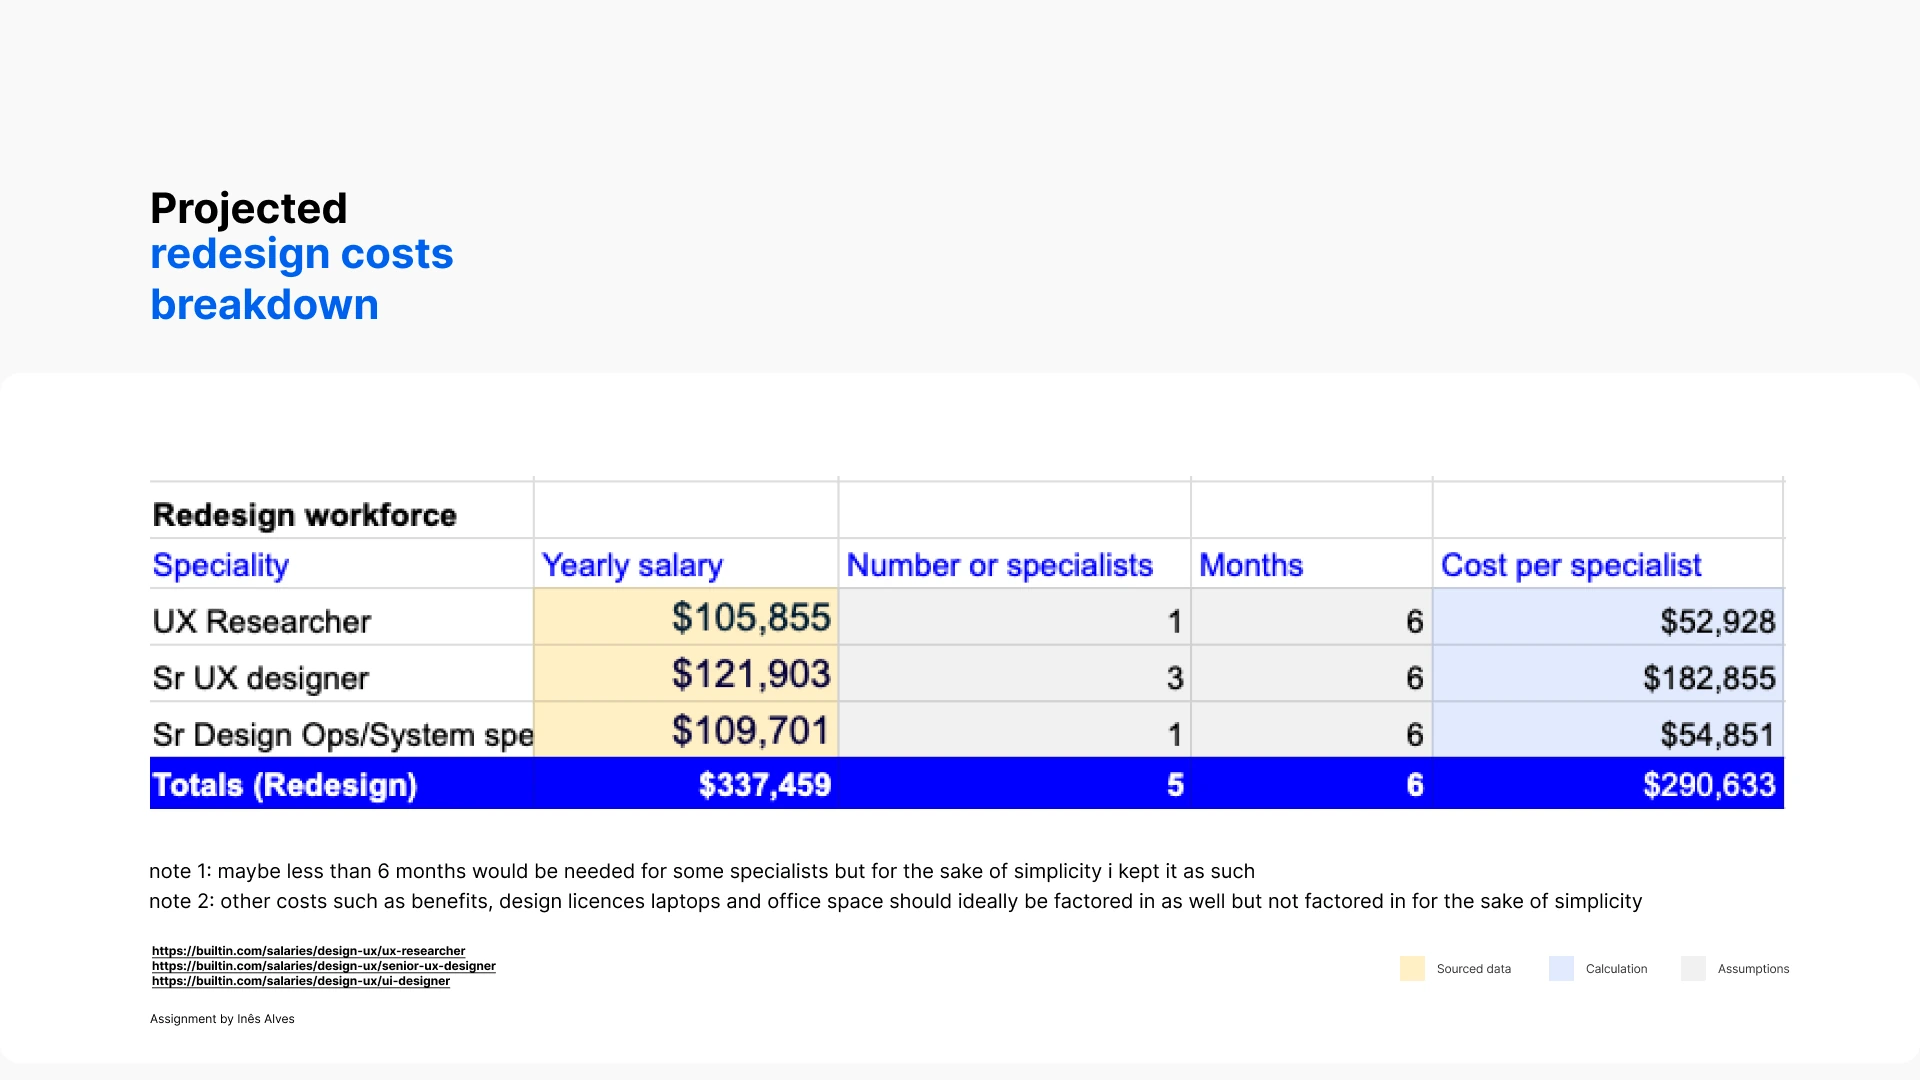
Projected redesign costs breakdown: 5 specialists, 6 months, $290,633 total.
I then built a 3-year, year-by-year model comparing profit with and without the redesign, holding annual subscription price constant and modelling retention, support and training assumptions in each scenario.
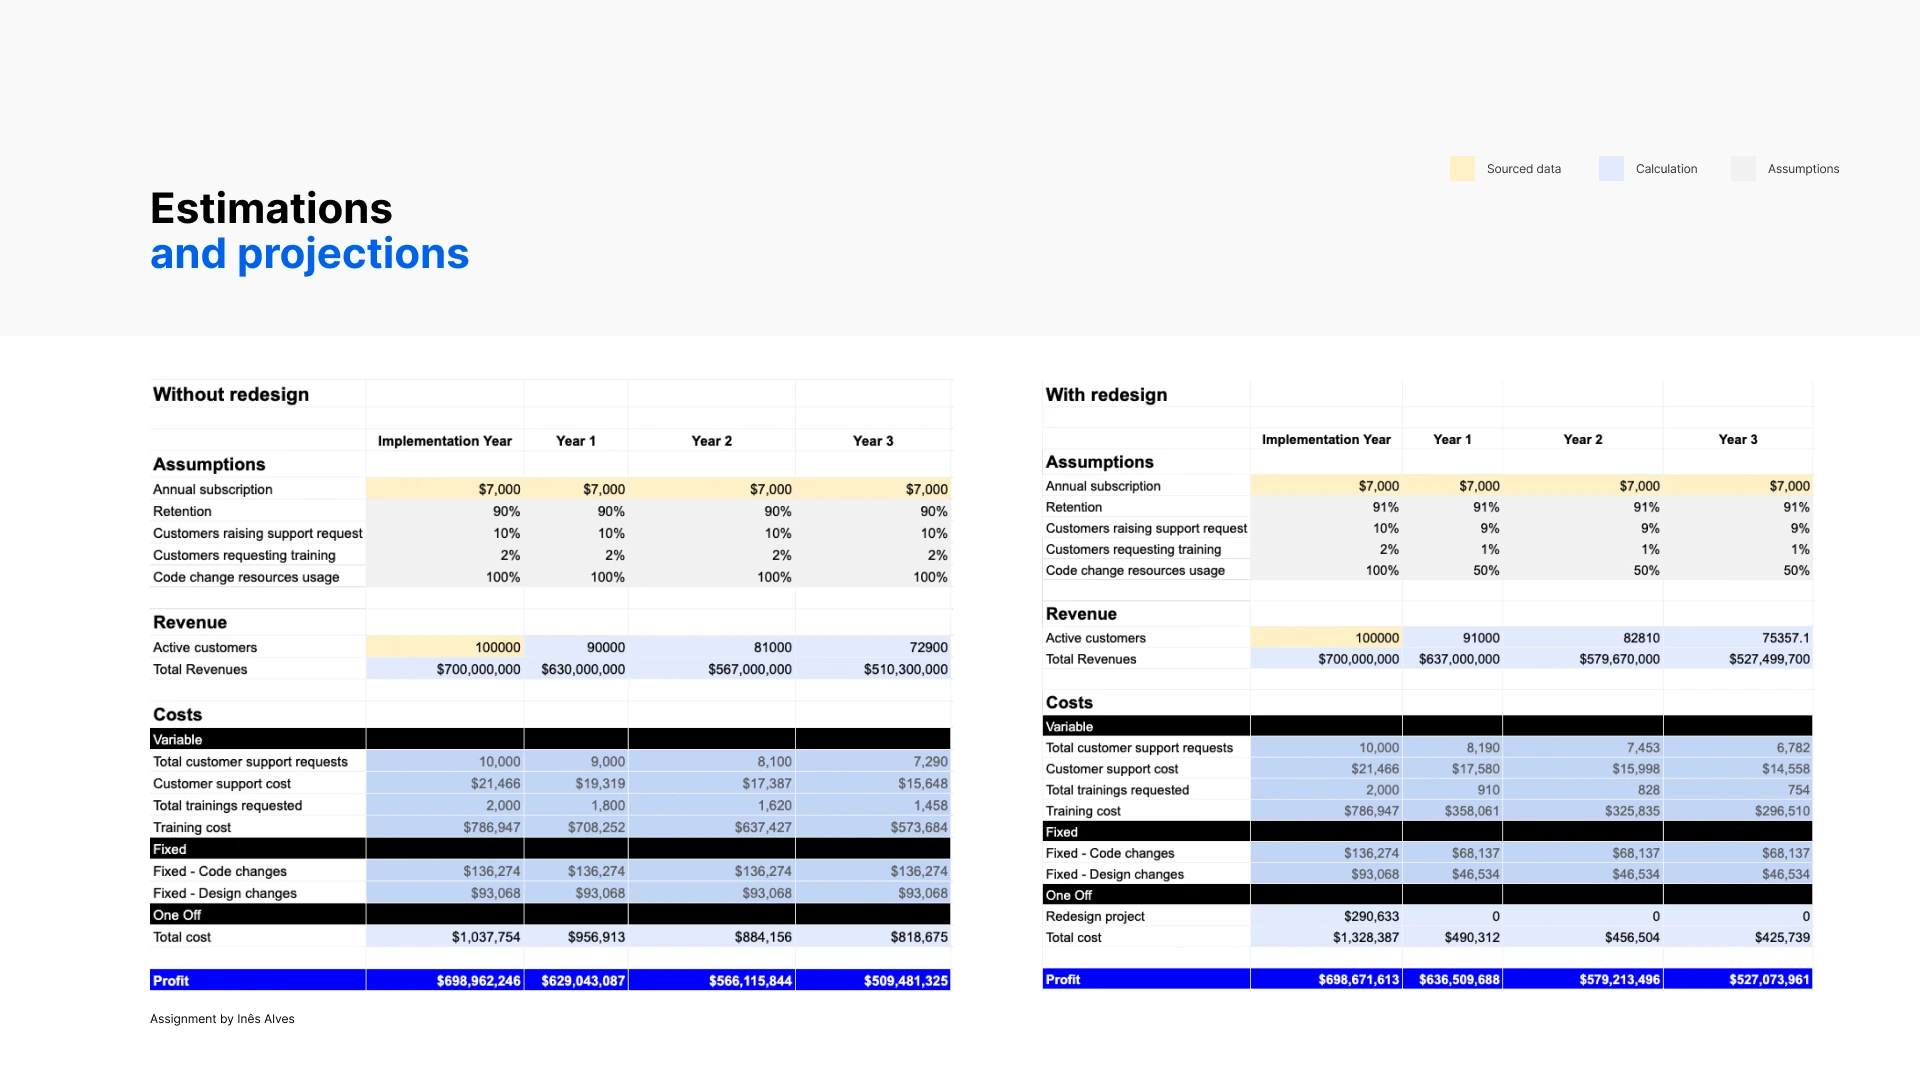
Estimations and projections: full assumption, revenue and cost breakdown for both scenarios across the implementation year and years 1-3.
Comparing the two profit lines directly makes the case: even after absorbing the one-off redesign cost in the implementation year, the redesign scenario overtakes the do-nothing scenario from Year 1 onward, and the gap widens every year after.
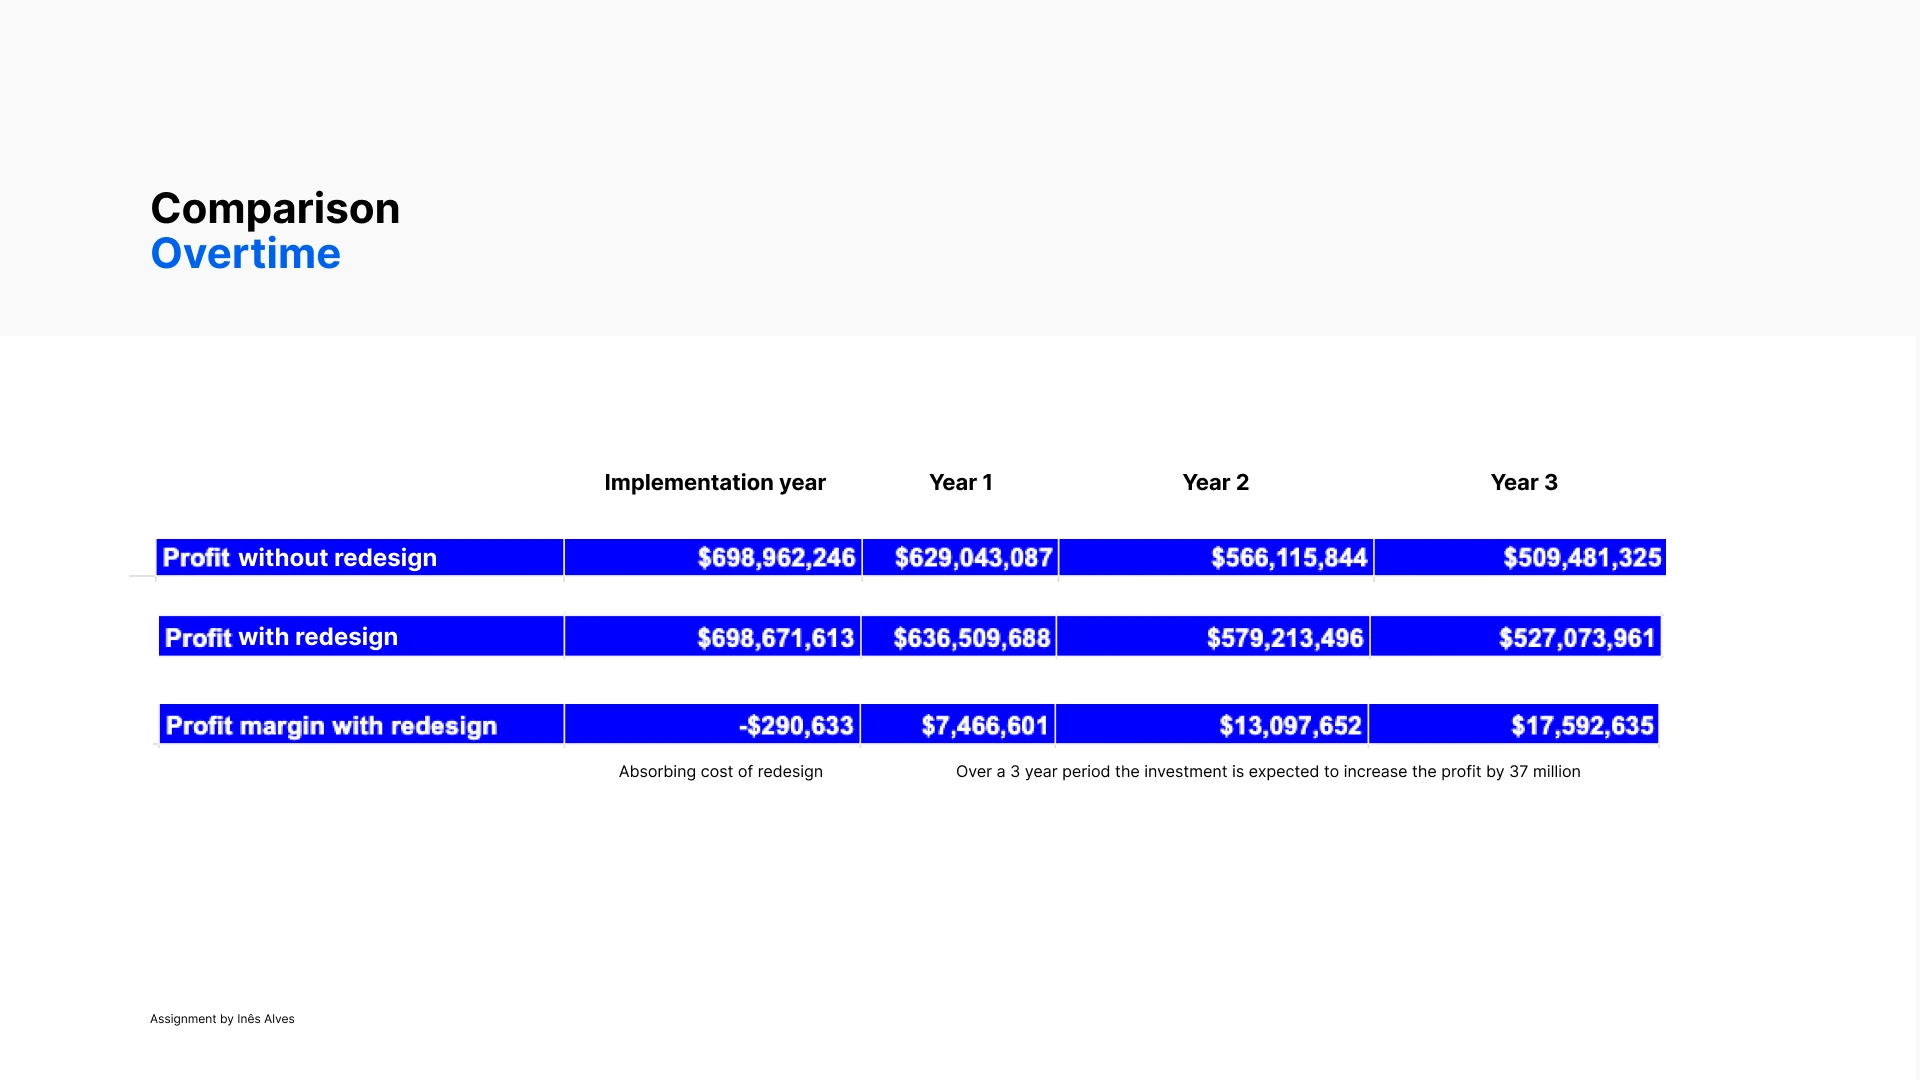
Comparison over time: absorbing the cost of redesign in year 1, the investment is expected to increase profit by $37M over a 3-year period.
Results & Business Impact
Results & Business Impact
A design case that speaks the language of the P&L.
A single retention-rate assumption, modelled year over year against the company's own cost structure, turned a design proposal into a $37M, 3-year financial case.
Projected profit increase over 3 years.
Retention increase used as the sole lever in the model, for simplicity.
One-off redesign cost, fully absorbed within the first year.
Friction, converted to cost
Naming the exact cost of a support ticket ($2.15) and a training session ($393.47) turned abstract UX friction into a line item a finance stakeholder could recognise immediately.
One lever, fully modelled
Focusing the model on retention alone, rather than every possible improvement, kept the projection simple, defensible and directly traceable to the profit tree.
"Turned a one-line stakeholder ask into a dollar figure the business could act on."
A repeatable model
The profit-tree, facts-and-hypothesis structure is reusable for any future design initiative needing to make its case in financial terms.
Fixed costs, halved
The model's own goal: cut design and dev bug-bash cost in half, from 12 to 6 months, by fixing journeys and design system patterns instead of individual components.
Sourced, not guessed
Every cost input was tagged as sourced data, a calculation, or an assumption, so stakeholders could see exactly where the numbers came from and challenge them directly.