Revenue insight and action steps to revert churn delivered to GTM leaders in their workflows.
Churned/downgraded contracts classified into an 18-category root-cause taxonomy.
Classification accuracy (0.722 weighted F1) against a manually labeled ground-truth set.
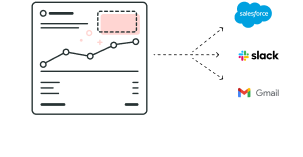
Delivery surfaces designed from one component : Salesforce widget, Slack alert, email digest.
Project Overview
Project Overview
The user problem
The company didn't have good insight into why customers were churning overall, and how that was changing over time. Executives had no instant, trustworthy answer to "why did this account leave?" at the deal level, and no credible trend view at the portfolio level.
The business objective
Give the company its first defensible, quantified view of why customers churn and how that's changing over time, delivered inside the workflows where account teams and executives already work, not as another dashboard destination.
The Solution
Cross customer churn overview
Use AI to analyse information about the customer (Salesforce emails, Zendesk tickets, notes from the account team in Salesforce or Gainsight, etc.), estimate why an account churned, and provide a dashboard overview.
Churned customer summary
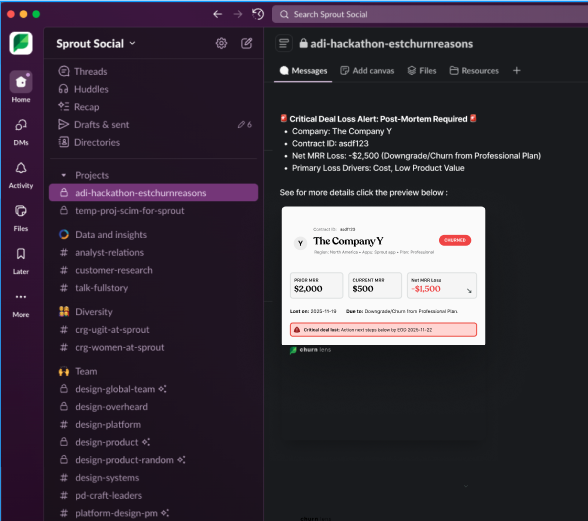
Keep key stakeholders informed about churned deals by integrating notifications into their workflow. Options proposed include Salesforce, Slack and email notification cards.
My role and scale of ownership
I partnered with a data scientist who owned the analysis pipeline in Hex: dataset creation, training-data collection, ground-truth labeling, LLM model training and prompt tuning.
I bridged data science with product strategy, turning the churn model into an executive decision-support product: defining the vision for real-time risk notifications with cause-specific resolution paths, driving stakeholder alignment, and mapping personas to enterprise use cases. I owned the end-to-end experience, from information architecture and AI interaction design to visual polish, vibe-coded prototyping, and the executive story that secured buy-in.
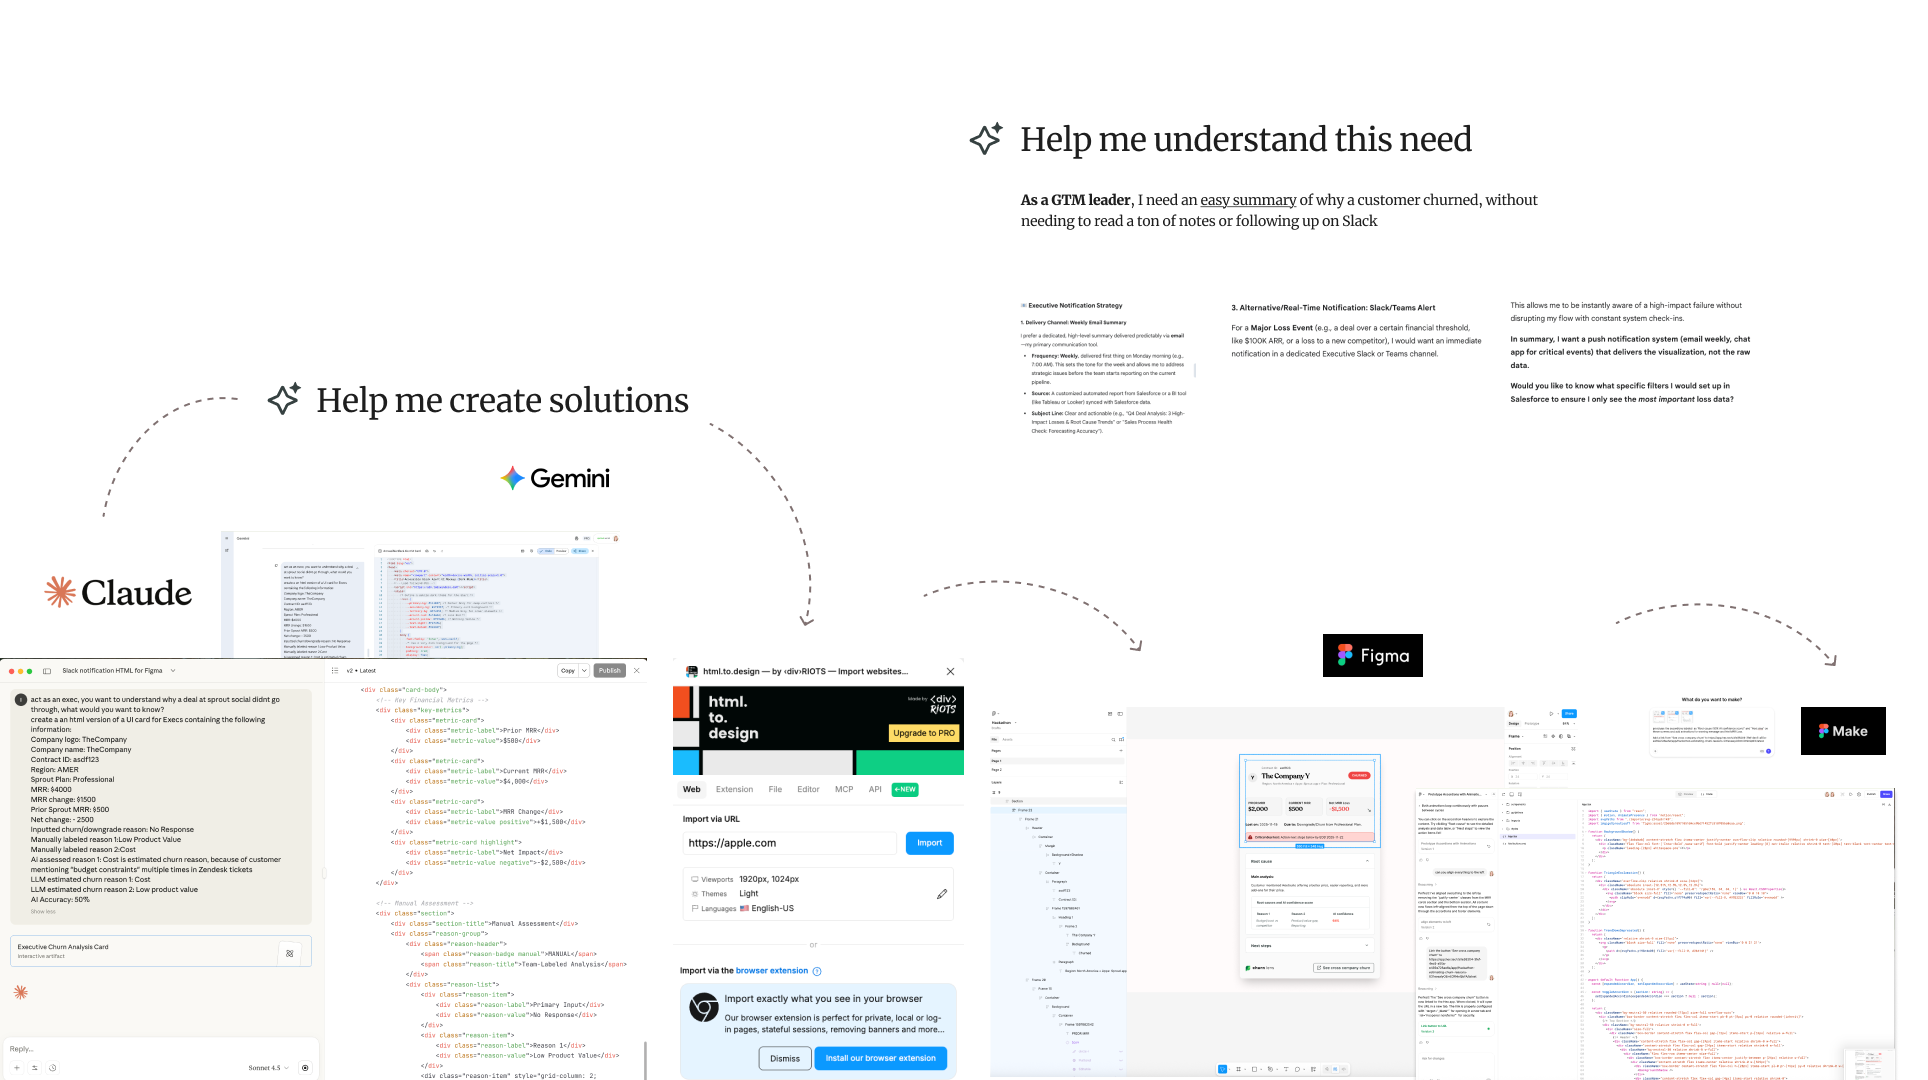
I used Claude and Gemini to generate divergent solution concepts, and finalized prototyping in Figma and Make, translating a machine-learning capability into a decision-support product.
How we got from insights to solution (in a 24-hour Hackathon)
Discover
- Defined the two core personas (RevOps/CX/Product executive and GTM leader) and their needs, and aligned with the data scientist on the data landscape.
Define
- Reframed the strategy with the data scientist, who built the dataset (7k+ contracts, reduced to 2.2k for training) and an 18-category taxonomy with ~500 ground-truth records.
Design
- Prompted Claude and Gemini with structured briefs to generate divergent first-pass UI concepts, piped them into Figma via html.to.design, converged on a single composable Churn card.
Deliver
- Vibe-coded the surface-agnostic card across the three channels where the need occurs, a Salesforce widget, a Slack alert, and a weekly email digest, and wired in deep links to Hex.




Execution
Execution
Reframing the problem before designing the solution
The highest-leverage move wasn't a screen. “Make people fill in the churn field” is a behavior-change strategy with a decade-long failure record, so we inverted it: let AI read what humans already write. Salesforce email threads, Zendesk tickets, and behavioral telemetry (session deltas, Inbox activity over 3-6 months) became the classification signal; the human role shifted from data entry to validation - a deliberate human-in-the-loop architecture.
- Optional manual data entryAccount teams (Customer Success Managers, Relationship Managers, Account Executives and others) had to manually input the reasons an account churned or downgraded in Salesforce, and those fields ("Churn Reason", "Downgrade Reason", etc.) were not mandatory, requiring manual time from customer-facing teams.
- Unstructured taxonomyAcross Salesforce and Zendesk the taxonomy itself was broken: 7 categories were too broad to act on, 47 too granular to trust. The richest signal lived in unstructured places (renewal notes, closed-lost narratives, Zendesk threads) where no dashboard could see it, and no credible portfolio-level trend view existed.
Lack of a unified system that provides instant summaries of individual customer churn reasons and longitudinal visibility into systemic churn trends.
As a RevOps/CX/Product executive, I need clear visibility on churn trends over time.
As a GTM leader, I need an easy summary of why a customer churned, without needing to read a ton of notes or follow up on Slack.
Shaping the solution
Answering need 1: churn trends in one view
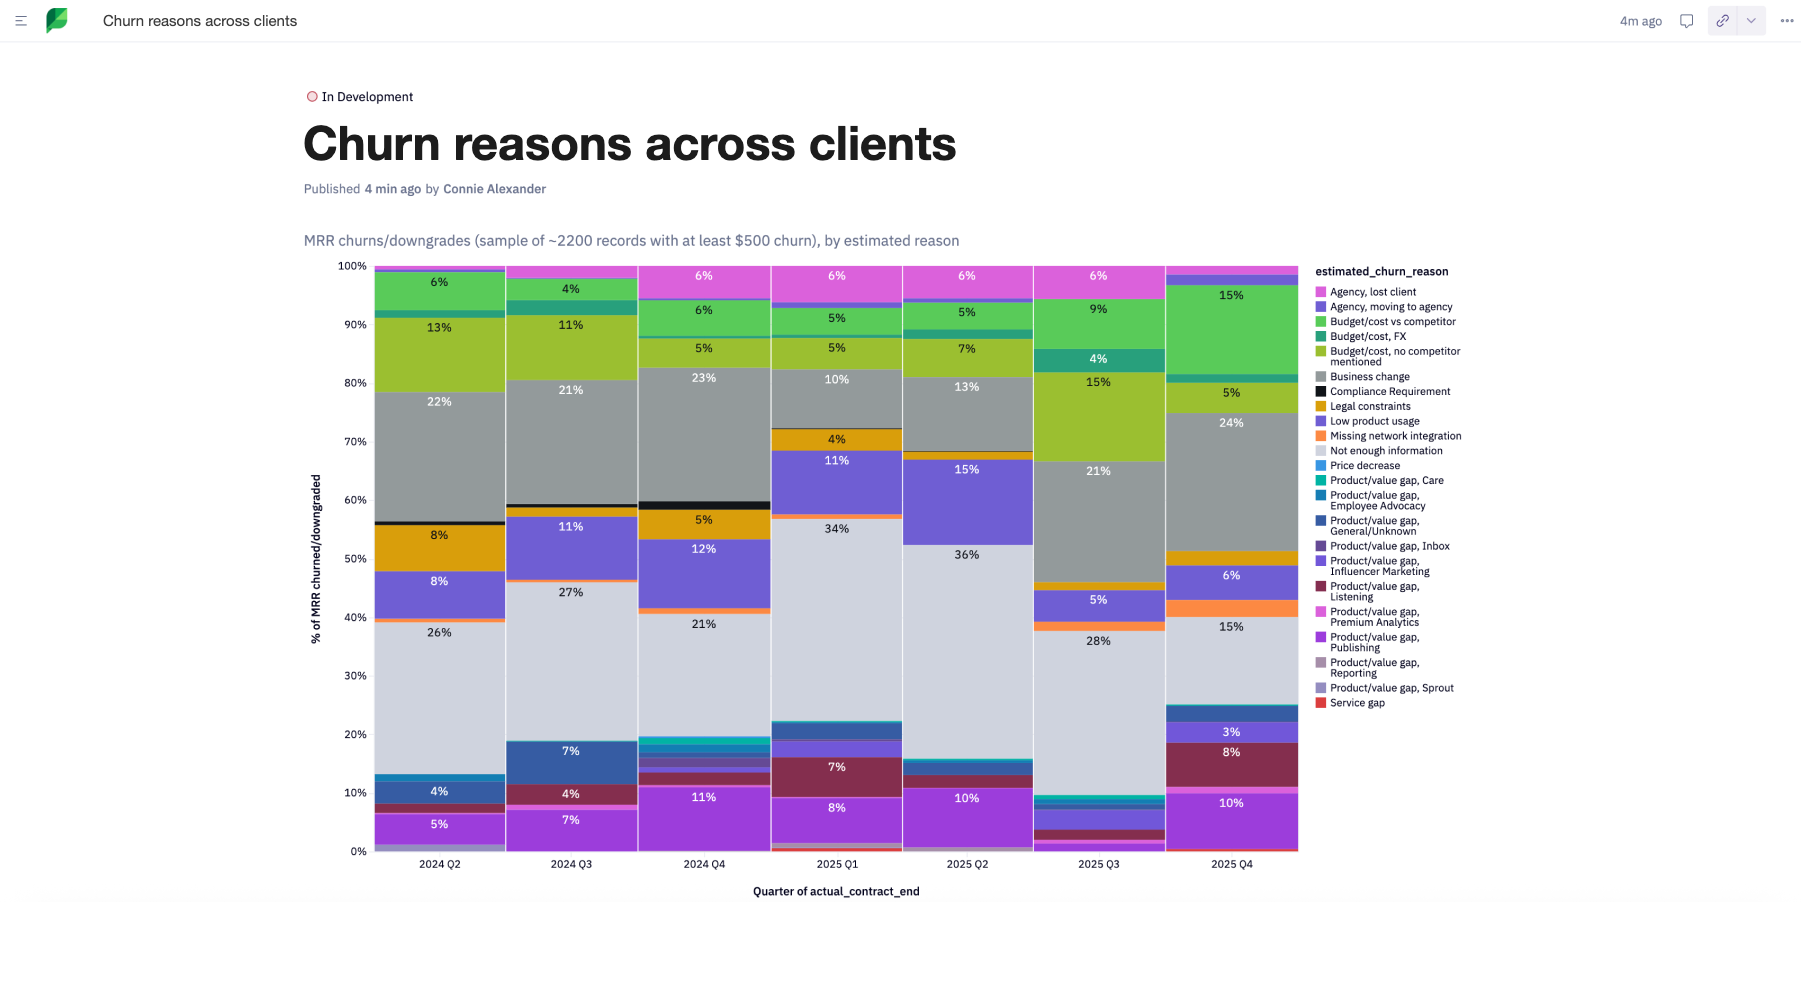
An LLM pipeline in Hex reads the unstructured trail an account leaves behind - Salesforce emails, Zendesk tickets, account-team notes - classifies the likely churn reason, and rolls every closed-lost deal into a dashboard of reasons by quarter.
Answering need 2: the summary comes to you
The same classified record is packaged as one Churn Lens card and pushed into the surfaces GTM leaders already live in - a Salesforce widget, a Slack alert, a weekly email digest - so nobody reads notes to learn why a customer left.
Designing for trust, not just accuracy
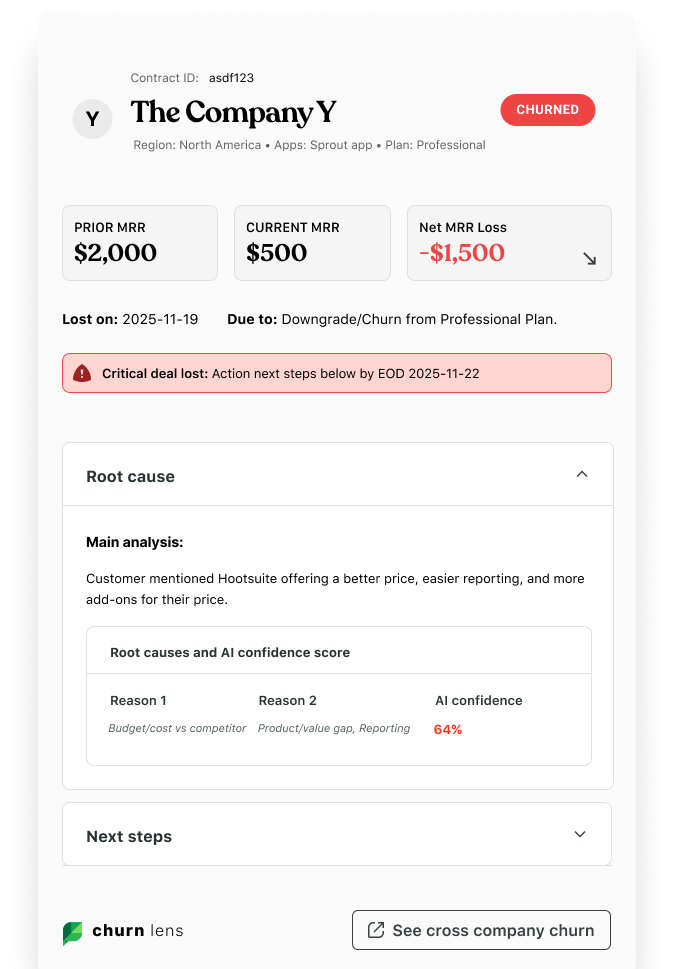
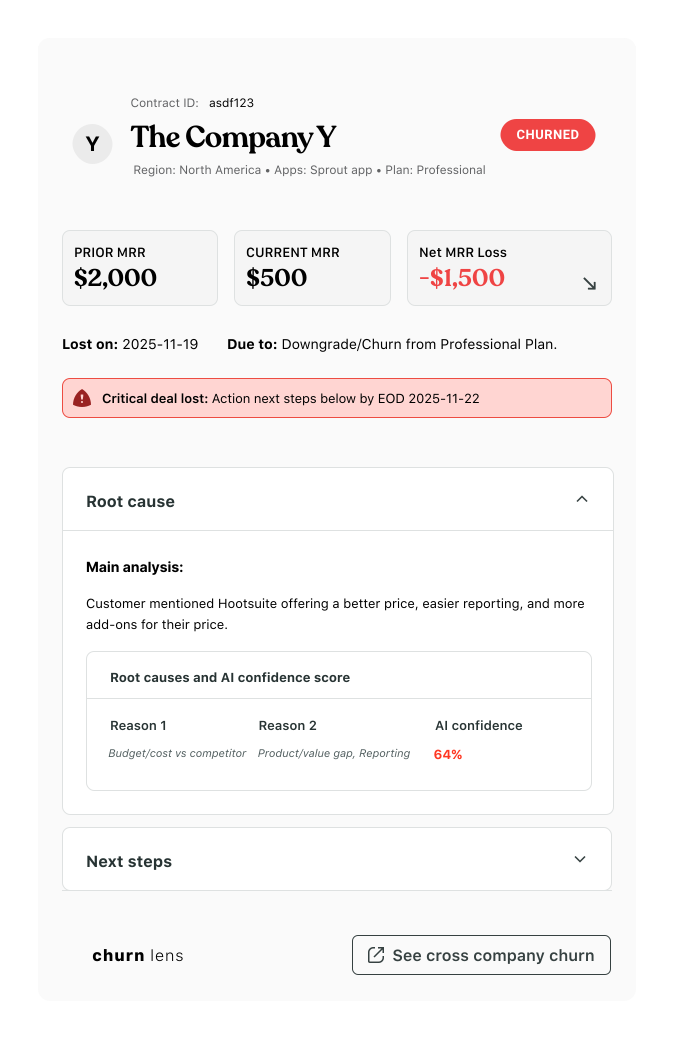
An AI system's honesty about uncertainty is a design decision. The data scientist prompted the model to abstain rather than hallucinate, defaulting to “Not enough information” under uncertainty and self-reporting confidence (High/Med/Low) on every prediction. 42.4% of predictions landed in “Not enough information,” with 45.5% self-rated low-confidence. Instead of hiding this, i suggested to make the AI confidence a first-class UI element, displayed alongside every root-cause claim in the summary card displaying churn per company. Calibrated transparency is what earns an AI feature the right to sit inside a revenue workflow.
Turning AI drafts into a design workflow
I prompted both Claude and Gemini with structured briefs (persona, data payload, decision context) to generate first-pass UI concepts as HTML, then piped outputs through html.to.design into Figma, compressing days of exploratory comping into hours and giving the team genuinely divergent starting points. Both model outputs failed in instructive, recurring ways, which I codified into a critique framework.
Missing data and inaccuracy (fabricated values in a numbers-critical surface), generic identity (dark-mode dashboard clichés with no connection to the brand), broken hierarchy (alarm-red banners shouting over the decision content), and cognitive load (everything expanded, everything urgent, nothing scannable). That framework became the brief for the human iteration passes: a repeatable AI-draft - human-elevate loop.
Prompt, generate, import, elevate
Converging on the Churn Lens card: AI + human collaboration
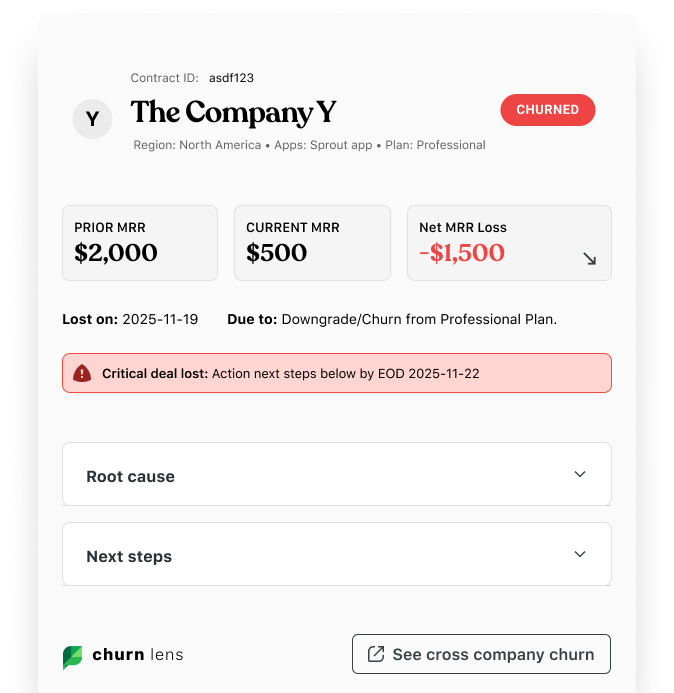
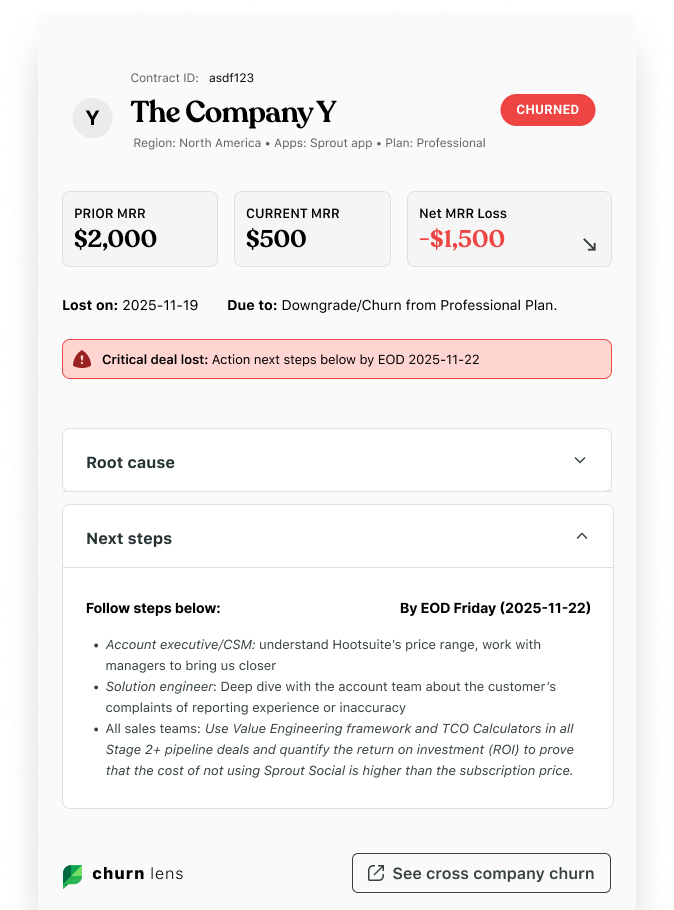
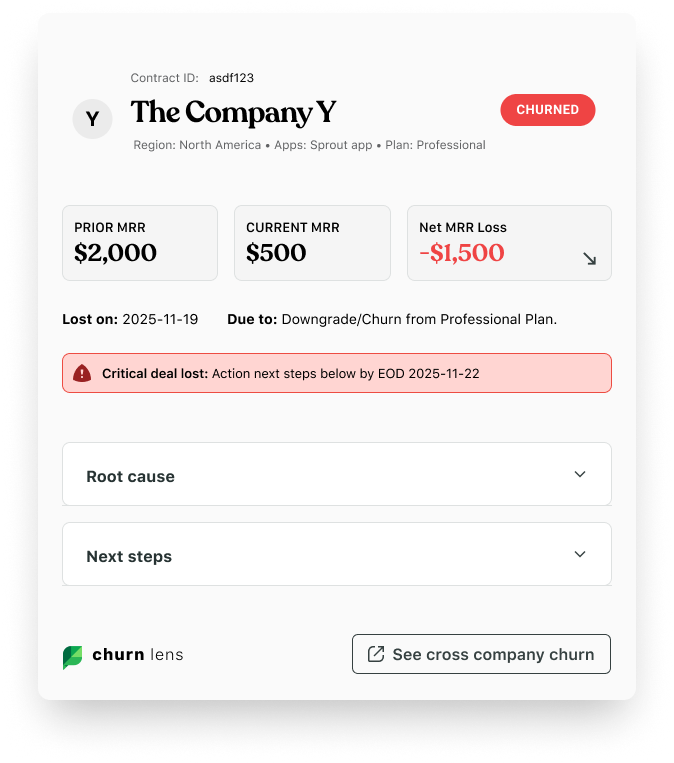
Through successive iterations I converged the system on a single, composable card engineered for executive scanning: an identity zone (company, contract, region, plan, unambiguous CHURNED chip); financial impact as the visual anchor (Prior MRR / Current MRR / Net MRR Loss in signal red); urgency contained to one inline alert band instead of full-bleed alarm headers; progressive disclosure of Root Cause and Next Steps via accordions, so the default state answers what happened and how bad in under five seconds; accountable AI (confidence scores beside every claim, next steps assigned to named roles with deadlines); and an escalation path linking deal-level insight to the portfolio dashboard.
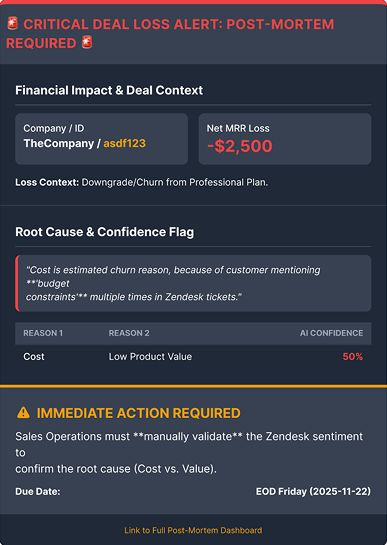
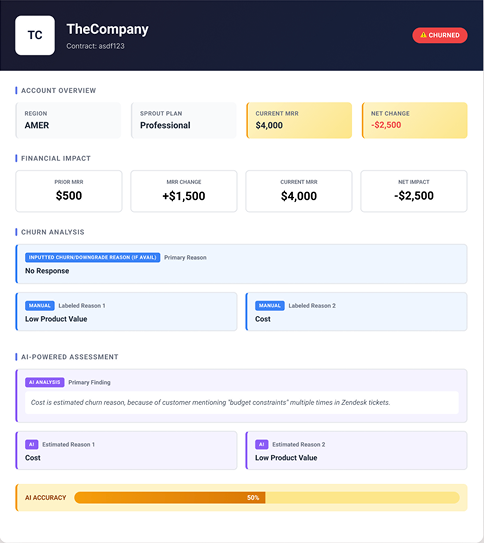
Gemini answered the brief with an incident report: a full-bleed red alarm header shouting over the decision content, dark-mode dashboard conventions with no link to the brand, and every section expanded at once. Urgency is asserted everywhere, so nothing is scannable.
Progressive disclosure in the card
I built the card as a working prototype and iterated on it conversationally, refining scroll behaviour, accordion states and the hand-off into Hex until the interaction felt right before any engineering time was spent.
The deep link points to the Hex dashboard our data scientist had already built: an out-of-the-box Hex visualisation we could not restyle, so the card hands off rather than tries to replicate it.

Iterating through prompts
One card, three workflow surfaces
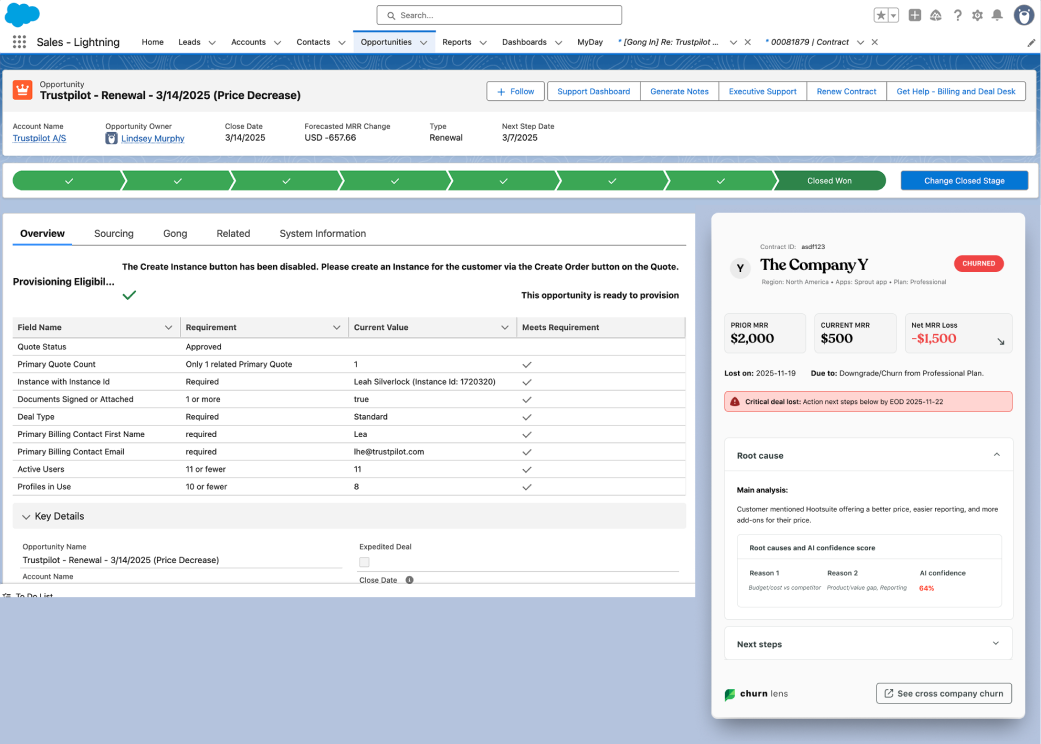
I designed Churn Lens as a surface-agnostic component, then prototyped it across the three channels where the moment of need actually occurs: a Salesforce widget embedded in the Opportunity record; a Slack alert in a dedicated channel for high-impact losses, deep-linking to the full record and Hex dashboard; and a weekly email digest for leaders who triage by inbox. Push the insight, don't demand a pilgrimage to a dashboard; notification strategy is information architecture.
Two routes to the same destination. Option A: the digest email carries the card, linking through to cross-company churn in Hex. Option B: a Slack notification leads to the card embedded in the Salesforce opportunity, then through to Hex. Both paths converge on the same dashboard centralised in Hex (out of scope for the design solution).
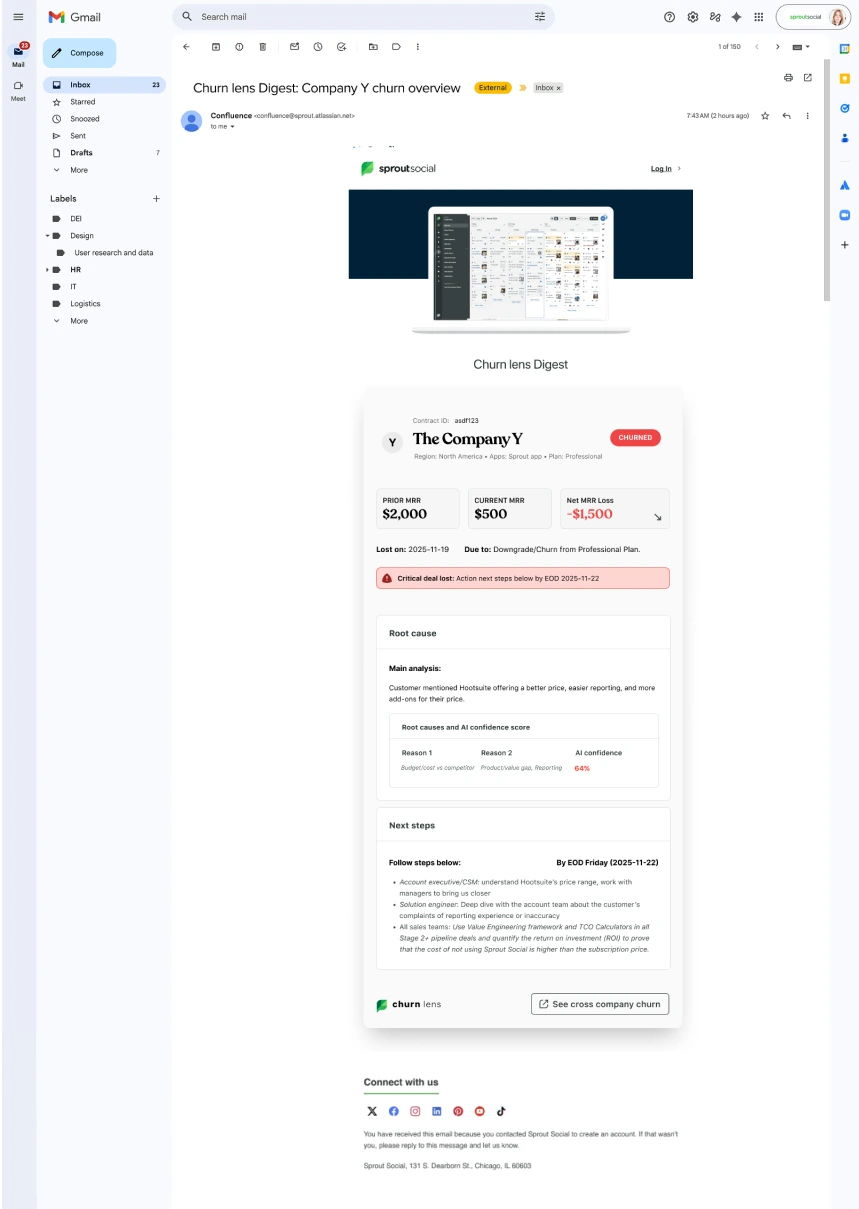
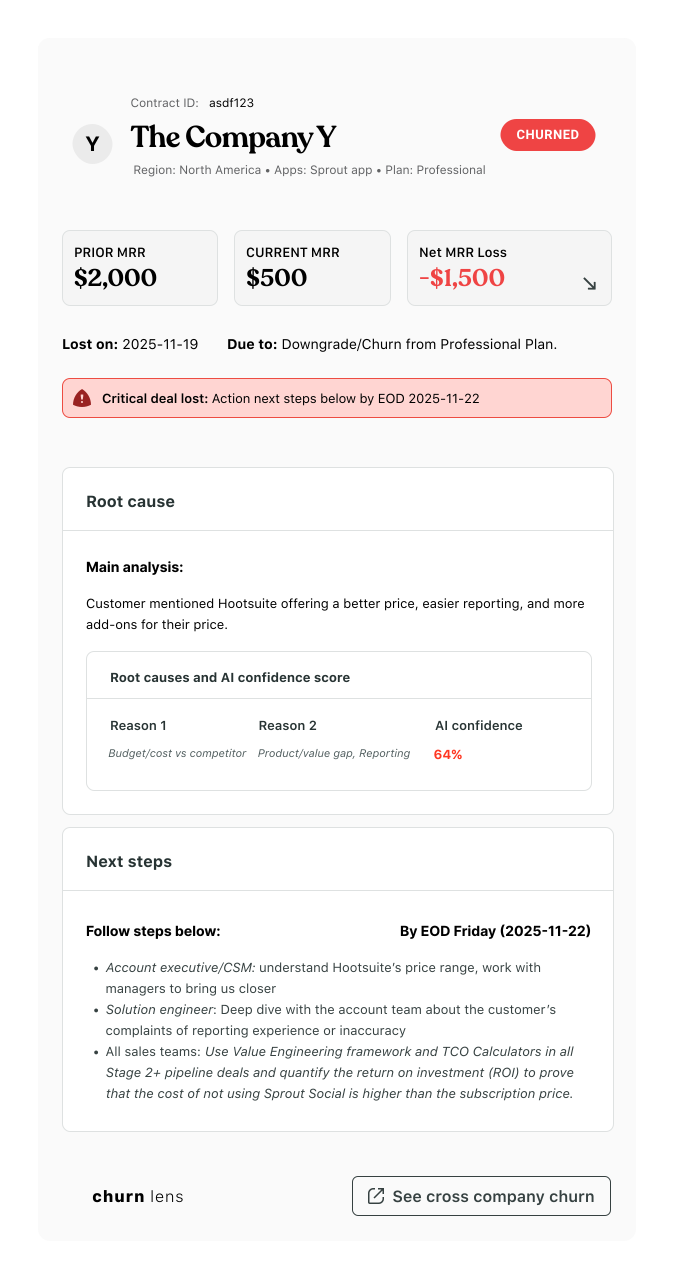

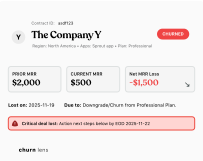


Option A - the weekly digest lands in the inbox with the full Churn Lens card inline: no login, no dashboard pilgrimage.
Results & Business Impact
Results & Business Impact
From anecdote to evidence
Leadership's first defensible, quantified view of churn drivers, revealing that Budget/Cost vs. Competitor churn nearly doubled (~7% → ~12% of churned MRR by 25Q3) and that Business Changes (mergers and acquisitions, consolidation) drove ~30% of churn, reframing an assumed product problem as a market-structure problem.
Contracts classified into an 18-category root-cause taxonomy.
Accuracy (0.722 weighted F1 on imbalanced classes).
Workflow surfaces served by one composable card.
Deal-level answers in seconds
GTM leaders get what happened, how bad, why, and what now from a single card: no note-reading, no Slack archaeology.
Trust built into the interface
Confidence scores, calibrated abstention, and role-assigned next steps made the AI's claims auditable rather than oracular.
Insight inside the workflow
Salesforce, Slack, and email delivery met each persona where they already work, closing the loop between frontline teams and executives.
"This wasn't just a notification center combined with a dashboard. The value came from reframing a data-entry problem as an AI-reading problem, treating model uncertainty as a design material, turning AI drafts into a critique-driven design workflow, and shipping one component across three workflow surfaces, all in a single day."
"We learnt that of the $ MRR churned in recent quarters and contracts we had estimations for, Budget/Cost vs. Competitor has been an increasing problem (~12% of MRR in 25Q3, up from ~7% in prior quarters), and Business Changes (e.g. M&A, consolidations) make up a surprising share of churn (about 30%!)."
From lagging report to timely intervention
Notifications reach account teams within a defined action window (critical deal alerts with an explicit end-of-day deadline), converting churn from something discovered in a quarterly review into something the team can still respond to: opening a save-play conversation, escalating pricing flexibility, or addressing the value gap before the relationship fully closes.
Every alert comes with a playbook
Each notification pairs the root cause with role-assigned, deadline-bound next steps (Account Executives and Customer Success Managers to understand the competitor's price range, Solution Engineers to dig into reporting complaints, all sales teams to apply Value Engineering and Total Cost of Ownership frameworks in Stage 2+ deals), so the insight arrives already translated into recoverable and preventable actions.
Churn prevention pushed upstream
Because the system surfaces patterns like rising Budget/Cost vs. Competitor pressure while deals are still in flight, the same intelligence that explains a lost account arms teams to protect at-risk ones, shifting the organization from post-mortem attribution toward proactive retention.